Role-Based KPI Tracking for Hospitality Operations Status: Dev-ready MVP Designs | Shelfed due to team capacity

Overview
My Role: Designer — User Journeys, Wireframing, Interface Design
Platform: Web application (3 role-based dashboards: General Manager, Housekeeper, Cleaner)
Timeline: 1-month engagement
Status: Wireframes and interface design complete. Project paused due to development team capacity constraints.
Context note: This case study is presented at the wireframe and initial interface stage. The project is on hold
Context
Hotel operations generate enormous volumes of daily data: occupancy rates, room turnover schedules, guest requests, utility costs, maintenance logs, and satisfaction ratings. Without a unified view, hotel managers spend hours reconciling data from separate systems and manually coordinating staff across shifts. This dashboard concept was designed to centralise operational data and automate task distribution across three user roles: the General Manager who needs high-level performance oversight, the Housekeeper who manages room turnover and guest requests, and the Cleaner who needs task-level assignments and completion tracking.
The Problem
Hotel operational data was siloed: occupancy rates in one system, cleaning schedules in another, guest satisfaction ratings in a third. Managers spent time aggregating rather than acting on data. For housekeeping and cleaning staff, task assignment was verbal or paper-based, creating inconsistency in room readiness standards and accountability gaps. The dashboard aimed to centralise data and automate task distribution so that every role received only the information and actions relevant to their specific function.
My Role and Constraints
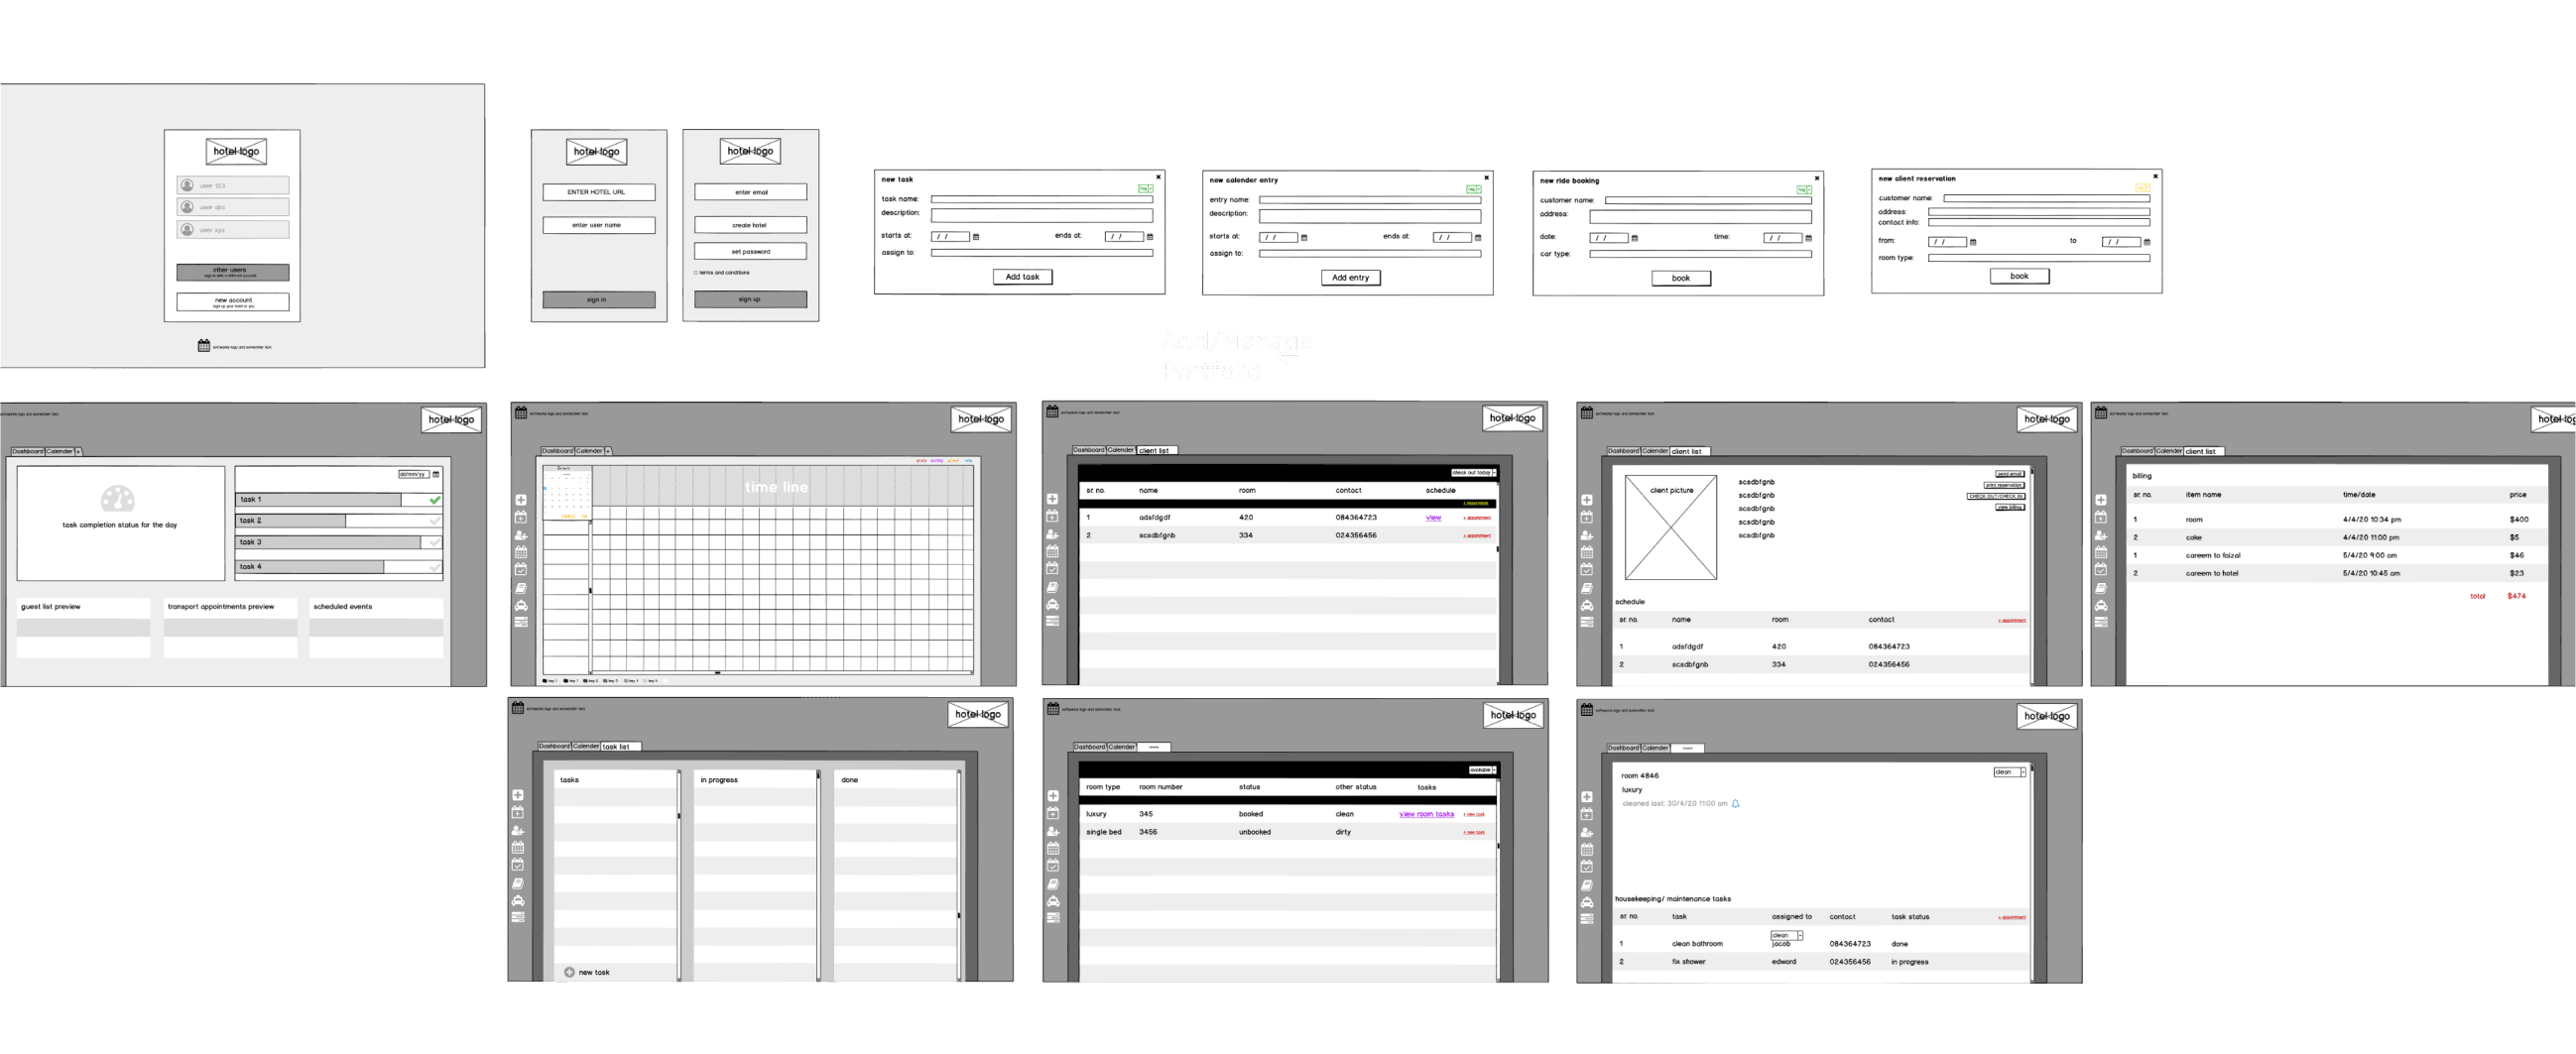
I was the designer on this project from user journey mapping through wireframing to initial interface design. The project was paused before full UI production due to the development team's capacity constraints. The design thinking and wireframe fidelity are the primary deliverables presented here.
Research and Discovery
I created detailed user journeys for each of the three roles to identify what information each role needed, at what point in their workflow, and with what urgency. This produced three fundamentally different information hierarchies:
General Manager: needs aggregated performance (occupancy, revenue, satisfaction scores) with drill-down capability to individual rooms or departments. Time horizon: daily, weekly, monthly comparison.
Housekeeper: needs real-time room status (cleaned, in progress, guest occupied, requires maintenance) with the ability to manage assignments and communicate with cleaning staff. Time horizon: shift-level, hourly.
Cleaner: needs task list with clear priority order, room location, and completion confirmation. Time horizon: task-level, immediate.
Key Design Decisions
Decision 1: Role-appropriate data density
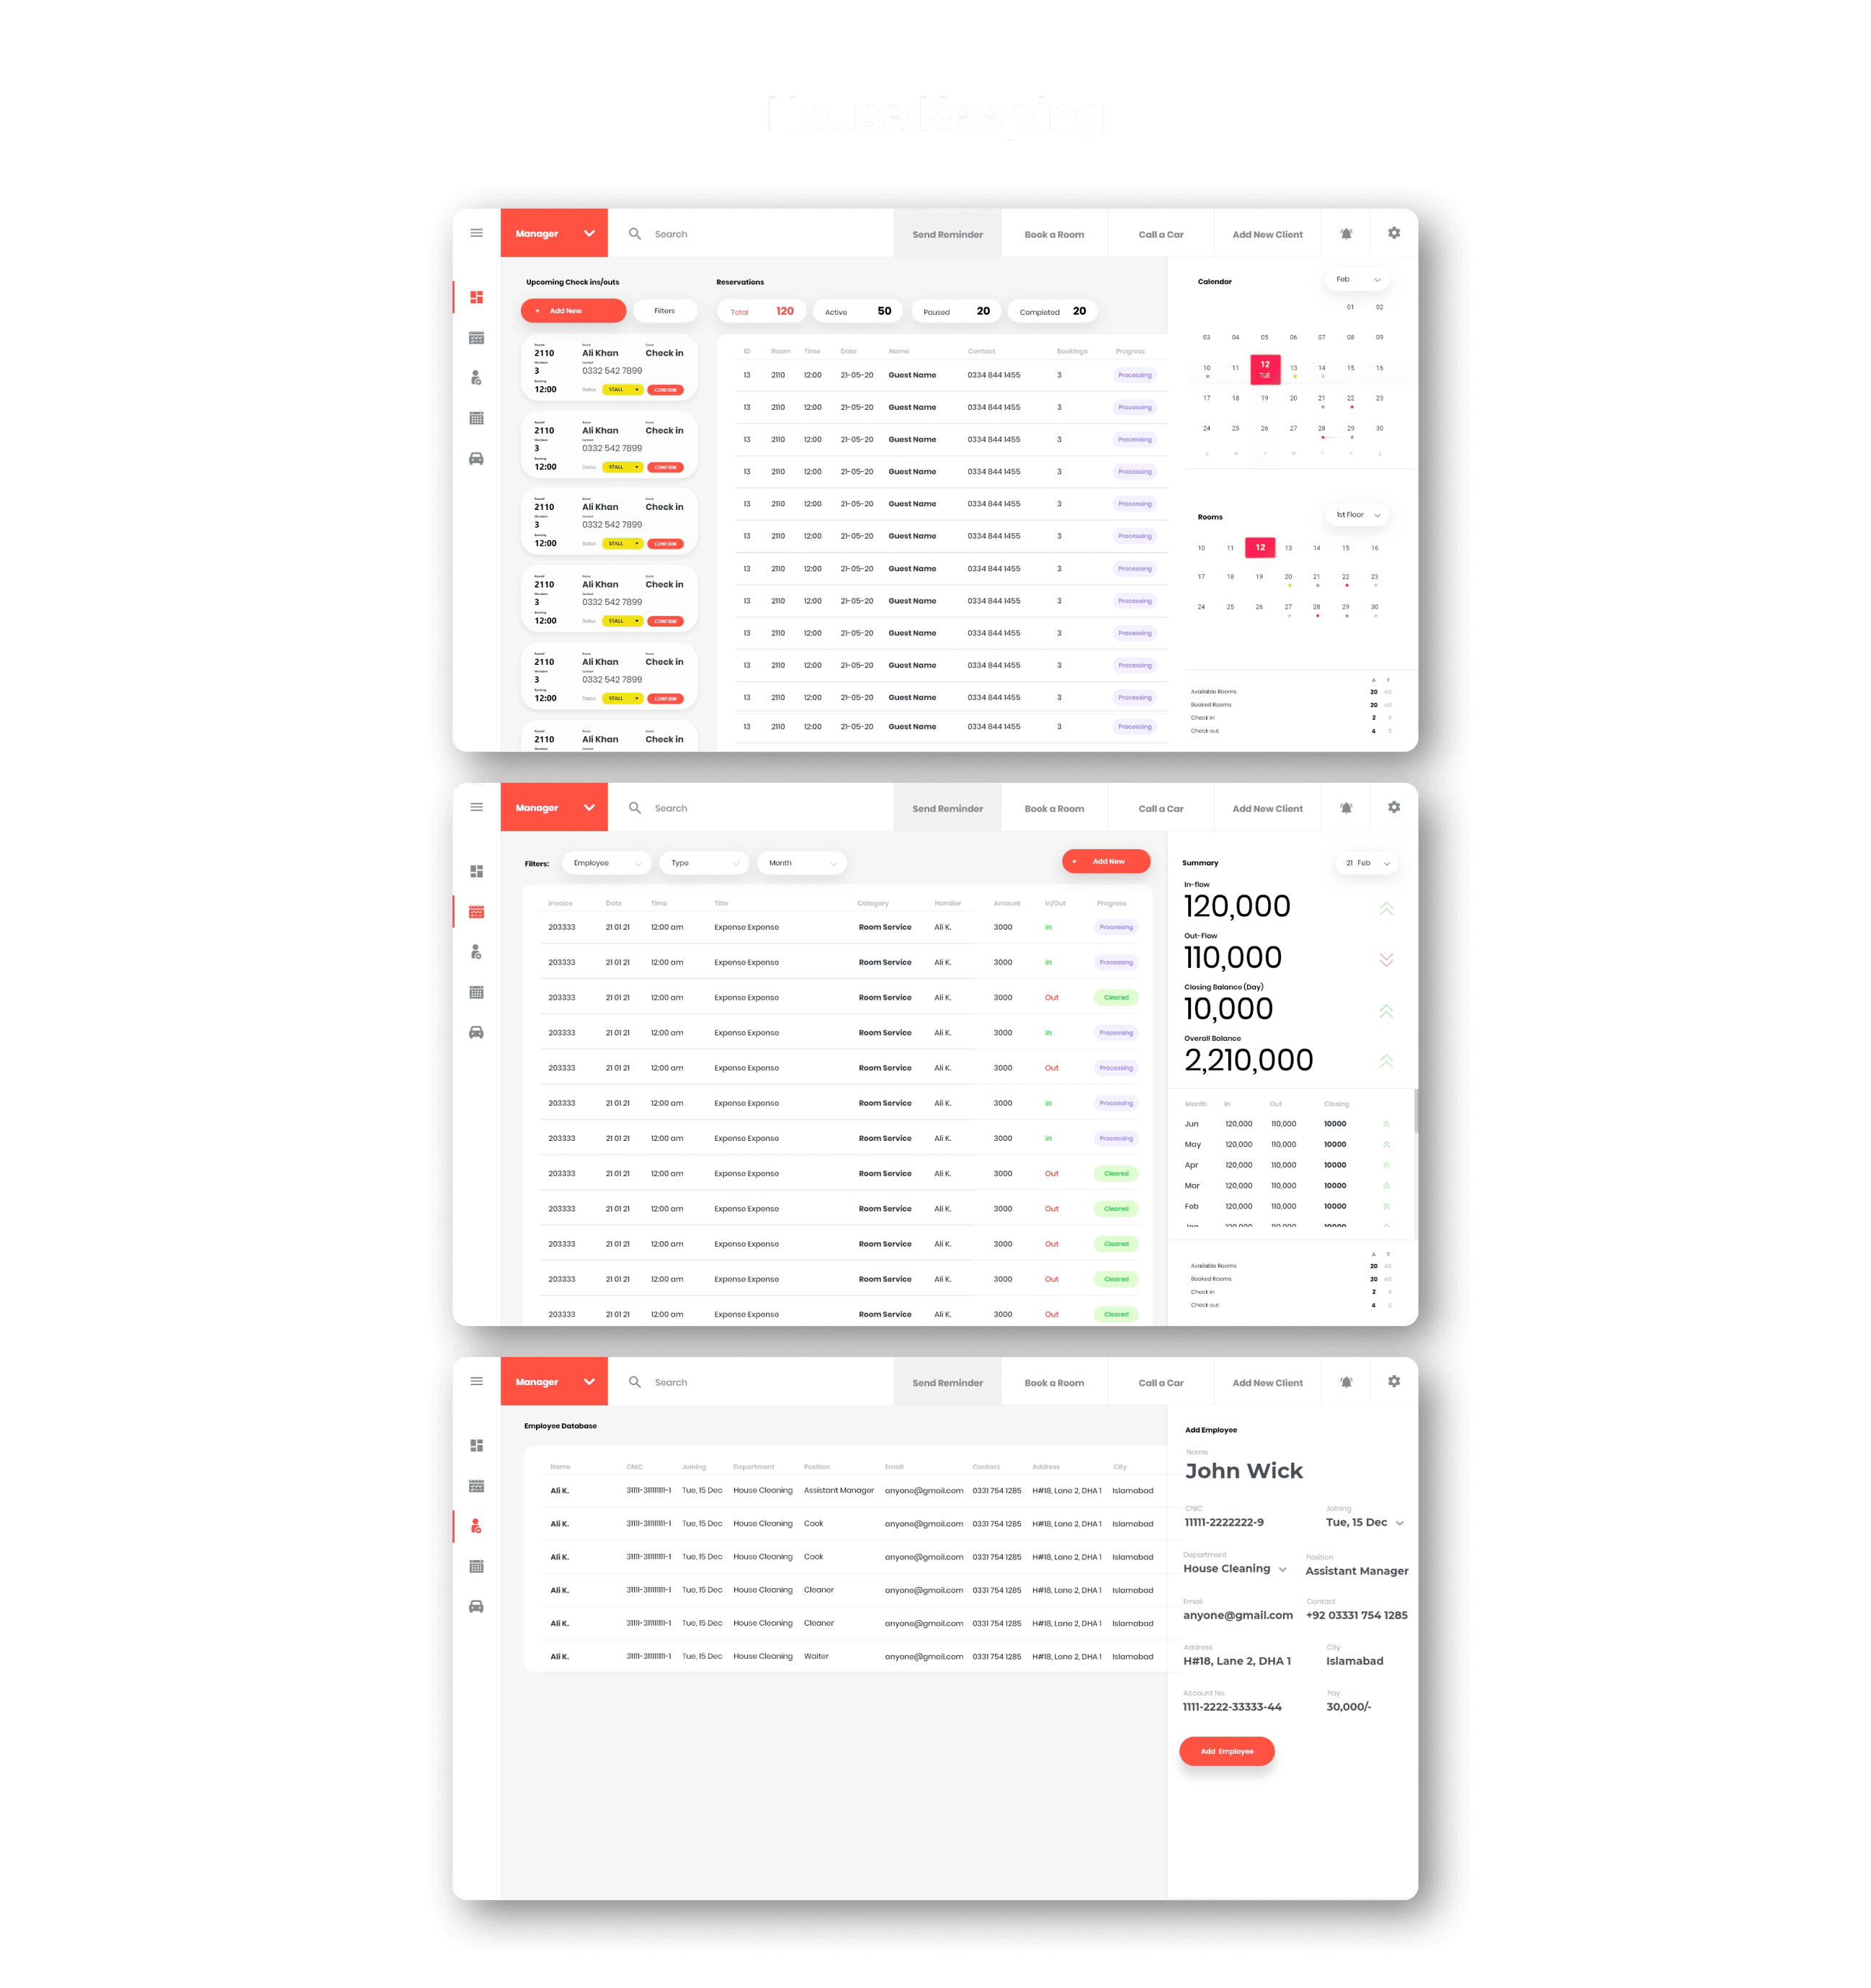
The General Manager dashboard is data-dense: charts, trends, comparisons across time periods, and financial metrics. The Cleaner dashboard is data-minimal: a prioritised task list with a completion checkbox as the primary interaction. The same visual design system produces two interfaces with radically different information density because the role requirements are radically different. Applying uniform density across all three would have made the GM dashboard too sparse and the Cleaner dashboard overwhelming.
Decision 2: Task automation as a design feature, not just a backend function
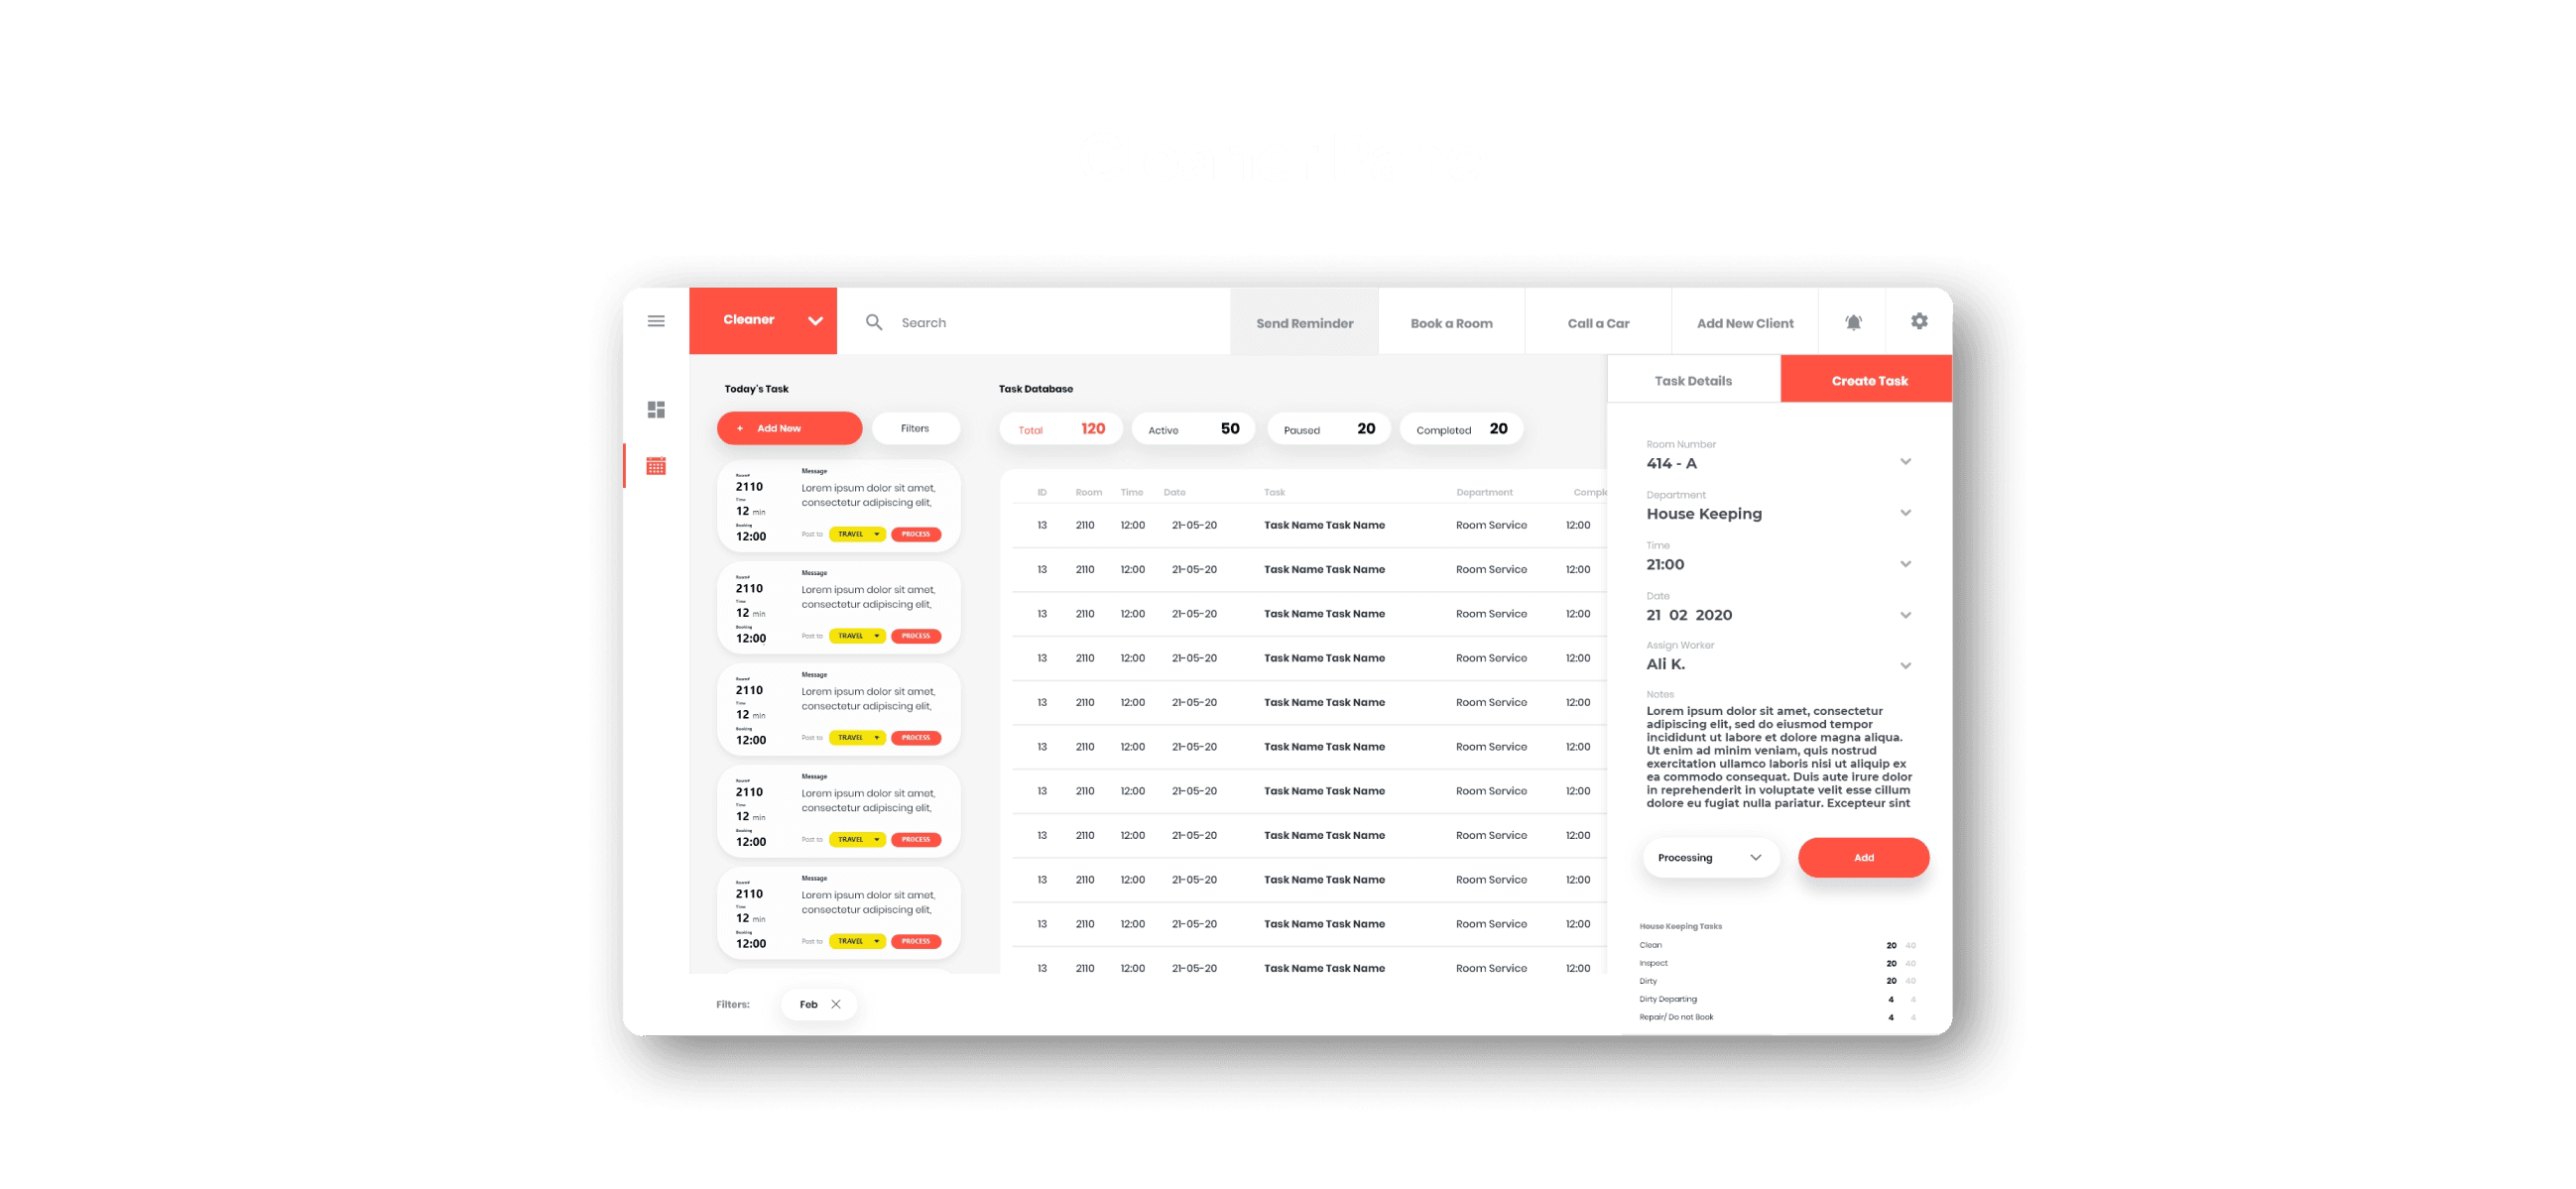
Task distribution (assigning rooms to cleaners based on shift schedule, room status, and cleaner capacity) was designed as a visible system in the Housekeeper dashboard rather than a purely automated background process. The housekeeper can see the automated assignments, understand the logic (room A assigned to Cleaner B because she is closest and on shift), and override if needed. Making the automation visible builds trust in the system and allows the housekeeper to remain accountable for the outcome even when the assignment is automated.
Decision 3: Remote access as a structural requirement, not a feature
Corporate hotel chains need managers to access branch-level data from headquarters or from home. This was designed as a structural requirement: all three dashboards were web-based and session-authenticated rather than location-locked. The architecture assumption was remote-first from the beginning.
The Solution
Three role-specific dashboards sharing a common data layer. The General Manager dashboard provides occupancy rate tracking, revenue analytics, customer satisfaction scores, utility cost monitoring, and department-level performance comparison. The Housekeeper dashboard provides real-time room status tracking, automated shift assignment with override capability, staff communication, and guest request management. The Cleaner dashboard provides prioritized task lists with room location, task type, completion confirmation, and shift tracking.
Outcome and Impact
The project reached the wireframing phase and initial MVP design before being paused. The user journey maps, three dashboard wireframes, and initial interface direction were completed to presentation quality. The project represents a complete design thinking output on a complex multi-role operational system, demonstrating the ability to decompose a single data domain into three appropriately differentiated user experiences.
Reflection
The hotel dashboard reinforced that designing for multiple roles within one system requires understanding what information a role does not need as clearly as what they do. The Cleaner's dashboard is valuable precisely because of what is not on it. Keeping managers, housekeepers, and cleaners out of each other's information space was as important a design decision as what each role's interface contained.

Disclaimer: The project discussed herein was undertaken as a part of the Little Studio team. The rights to this project are jointly owned by the client and the studio. This case study is presented solely to showcase my individual contributions to the project.